ISSN: 1839-9940

 Global reach, higher impact
J Genomics 2018; 6:88-97. doi:10.7150/jgen.26491 This volume Cite
Research Paper
Genetic Diversity of Bovine Major Histocompatibility Complex Class II DRB3 locus in cattle breeds from Asia compared to those from Africa and America
Sunday O. Peters1,2 ![]() , Tanveer Hussain3, Adeyemi S. Adenaike4, Matthew A Adeleke5, Marcos De Donato6, Jordan Hazzard1, Masroor E Babar3, Ikhide G. Imumorin7,8
, Tanveer Hussain3, Adeyemi S. Adenaike4, Matthew A Adeleke5, Marcos De Donato6, Jordan Hazzard1, Masroor E Babar3, Ikhide G. Imumorin7,8
1. Department of Animal Science, Berry College, Mount Berry, GA 30149
2. Department of Animal and Dairy Science, University of Georgia, Athens, GA 30602
3. Department of Molecular Biology, Virtual University of Pakistan, Lahore, Pakistan
4. Department of Animal Breeding and Genetics, Federal University of Agriculture, Abeokuta, Nigeria
5. Discipline of Genetics, School of Life Sciences, University of KwaZulu-Natal (Westville Campus), P/Bag X54001, Durban 4000, South Africa
6. Tecnologico de Monterrey, Escuela de Ingenieria y Ciencias, Quretaro, Mexico
7. School of Biological Sciences, Georgia Institute of Technology, Atlanta, GA 30332
8. African Institute for Bioscience Research and Training, Ibadan, Nigeria
Received 2018-4-4; Accepted 2018-5-25; Published 2018-6-12
Abstract

Genetic polymorphisms and diversity of BoLA-DRB3.2 are essential because of DRB3 gene's function in innate immunity and its association with infectious diseases resistance or tolerance in cattle. The present study was aimed at assessing the level of genetic diversity of DRB3 in the exon 2 (BoLA-DRB3.2) region in African, American and Asian cattle breeds. Amplification of exon 2 in 174 cattle revealed 15 haplotypes. The breeds with the highest number of haplotypes were Brangus (10), Sokoto Gudali (10) and Dajal (9), while the lowest number of haplotypes were found in Holstein and Sahiwal with 4 haplotypes each. Medium Joining network obtained from haplotypic data showed that all haplotypes condensed around a centric area and each sequence (except in H-3, H-51 and H-106) representing almost a specific haplotype. The BoLA-DRB3.2 sequence analyses revealed a non-significant higher rate of non-synonymous (dN) compared to synonymous substitutions (dS). The ratio of dN/dS substitution across the breeds were observed to be greater than one suggesting that variation at the antigen-binding sites is under positive selection; thus increasing the chances of these breeds to respond to wide array of pathogenic attacks. An analysis of molecular variance revealed that 94.01 and 5.99% of the genetic variation was attributable to differences within and among populations, respectively. Generally, results obtained suggest that within breed genetic variation across breeds is higher than between breeds. This genetic information will be important for investigating the relationship between BoLADRB3.2 and diseases in various cattle breeds studied with attendant implication on designing breeding programs that will aim at selecting individual cattle that carry resistant alleles.
Keywords: BoLA-DRB3.2, Gene polymorphism, Cattle, Diseases
Introduction
The major histocompatibility complex (MHC) is the primary genetic component of the mammalian immune system, because its genes are vital for the initiation of the adaptive immune response [1]. The high polymorphism observed in MHC region has been associated with the effectiveness of its immunological non-self or self-recognition function [2]. Cattle MHC molecules are divided into class I and II. A major rearrangement within the class II region has led to the division of the MHC region into two distinct sub-regions, such as class IIa and class IIb, on chromosome 23 [3]. The class IIa sub-region contains the functionally expressed DR and DQ genes [4]. Among the three DRB genes, DRB3 is believed to be functionally important [5]. The DRB3 gene is the most polymorphic class II locus in cattle and influences both the magnitude and epitope specificity of antigen-specific T cell responses to infectious diseases [4]. BoLA-DRB3.2 which is the second exon of the third DRB bovine gene is responsible for the β1 domain of the only widely expressed DRB gene in cattle. There is an increasing effort to characterize bovine MHC allele frequencies by breed and location because of the role of BoLA-DRB3 allele in resistance and/or susceptibility to infectious diseases and immunology [6, 7, 8].
A comprehensive review of the major histocompatibility complex in bovines was documented by Behl et al. [3] and concluded that high polymorphism in DRB3.2 locus could assist in identification of superior haplotypes for disease resistance. Takeshima et al. [9] reported high levels of BoLA-DRB3 and identified 5 novel BoLA-DRB3 alleles in Philippine native cattle. While the study provided evidence for evolutionary relationships between the cattle breeds based on BoLA-DRB3 allele, it was concluded that allelic information discovered would be essential to understand the correlation between MHC and diseases in East Asian cattle. Extensive inter-individual variation of BoLA-DRB3 in the level of infection to bovine leukemia virus was reported by Carignano et al. [8] in Holstein and Holstein x Jersey crossbred dairy cattle. The authors identified two BoLA-DRB3 alleles that were related to high level infection. The authors further recommended the need to employ large SNPs for accurate detection of genes responsible for phenotypic variation observed in cattle infected with bovine leukemia virus. Miyasaka et al. [10] reported an association between the DRB3-DQA1 haplotype and variations in bovine leukemia virus proviral load in Japanese Black cattle. Following characterization, Bai et al. [11] identified a common B cell epitope in bovine leukemia virus through comprehensive screening of BLV-infected cattle that had varied genetic profile in BoLA-DRB3. Juliarena et al. [12] obtained strong association of the BoLA-DRB3.2*0902 allele with low proviral load profile in infected cattle with bovine leukemia virus but concluded that the strong relationship was not sufficient to provide general explanation for animals in every herd that are resistant to bovine leukemia virus.
However, according to Lützelschwab et al. [13], Mycobacterium bovis co-infection does not influence the ability of cattle, either they carry or do not, to have the resistant allele in BoLA-DRB3 to bovine leukemia virus. Das et al. [14] also documented a highly polymorphic BoLA-DRB3 on exon2 with significant breed-specific genetic diversities in three Bos indicus cattle breeds of South Indian hence recommended conservation to maintain native cattle genetic diversity. In Latin American Creole cattle breeds, Giovambattista et al. [15] reported high genetic diversity of MHC DRB3 which could be as a result of multiple sources of germplasm and could be maintained by balancing selection. Takeshima et al. [16] investigated bovine MHC class II DRB3 in South American Holstein cattle populations and reported high degree of genetic diversity with a low population genetic structure. Sun et al. [7] investigated the effect of BoLA-DRB3.2 polymorphisms on lameness of Chinese Holstein cows and concluded that BoLA-DRB3 exon2 might be a candidate gene for lameness susceptibility in Chinese Holstein cows. It is important to note that genotype effect at the BoLA-DRB3 could not explain variation in somatic cell count and milk yield at an extent expected of a genetic marker, Oprzadek et al. [17] concluded the locus is just an ordinary position of the polygene when interpreting genetic variance of somatic cell count and milk.
More than 100 alleles of DRB3 gene have been identified by DNA sequencing (www.ebi.ac.uk/ipd/mhc [3]). The allele frequencies of BoLA class II genes appear to vary between breeds of cattle, such as Jersey, Holstein, Argentine Creole, Japanese Shorthorn, Japanese Black, and Brazilian dairy Gir [8, 15, 18, 19, 20, 21]. Thus, estimating the frequency of BoLA class II alleles can help to identify the influence of selective forces such as symmetric balancing selection and positive selection, and differentiate between various populations of cattle [20, 21]. At present, information on the degree of MHC DBR3 variability in natural populations of African cattle is still meagre. Knowledge of the genetic diversity in the DBR3 gene in cattle breeds that cut across three continents (Africa, North America and Asia), which is the main focus of this study, will provide valuable information in assessing the extent of polymorphisms at this locus and a window at which breeds would respond to wide arrays of pathogenic insult, which consequentially determines their level of fitness in their environment.
Methods and materials
DNA extraction
Blood samples (10 ml) were collected from 17 geographically separated cattle breeds from Africa (Nigeria), Asia (Pakistan) and United States of America (North America). The list of breeds is included in Table 1. These blood samples were processed for genomic DNA isolation. Sampling from related individuals was avoided to keep them unrelated. Organic DNA extraction method was employed as described by Babar et al. [22]. The DNA quantification and quality was done using NanoDrop 2000 (Thermo Scientific, Wilmington, DE). Gel Electrophoresis was also used to determine the intergrity of the DNA used. All samples were brought to the same concentration of 50ng/ul. The protocol for this research was approved by Institutional Animal Use and Care Committee of Cornell University.
Primers, PCR amplification and Sequencing
Specific primers (forward 5'-TATCCCGTCTCTGCAGCACA-3' and reverse 5'- TCGCCGCTGCACACTGAAAC-3') were designed for the amplification of BoLA-DRB3 exon 2 sequence of Bos taurus available from GenBank NCBI (AC# AB523809) using Primer3 software [23].
The primers were used to amplify the desired sequence region through Applied Biosystem GeneAmp 9700 system using a reaction mixture of 25 µL, 2.5 uL 100 µM of dNTPs, 1µL of template DNA, 1 uL of 0.1µM of each primer, 2.5 mM MgCl2 and 1.5 U of Taq DNA polymerase (Fermentas, Thermo Fisher Scientific Inc. USA). For PCR conditions include the initial denaturation at 95ºC for 5 min, 35 cycles of denaturation at 95ºC for 30s, annealing at 60 °C for 30s and extension at 72°C for 45s followed by final extension at 72ºC for 10 min. PCR products from amplified DNA of cattle breeds from African, Asian and America were sent to Cornell University Core Lab for Sanger sequencing in a Genetic Analyzer 3130 xL (Applied Biosystems, Inc., Foster City, CA). Sequences were cleaned, edited and SNPs were identified with the help of CodonCode aligner software (Codon Code Corporation).
Sequence Analysis
Two hundred and forty-four (244) base pairs from the DRB3 exon 2 region of 44 individuals of 4 African cattle breeds, 23 sequences from 3 breeds from the United State of American, and 107 sequences of 10 cattle breeds from Pakistan were aligned using ClustalW software package [24]. Minor adjustments were made to the alignments after visual inspection. Indices of sequence variation and haplotype structure were calculated using DnaSP version 5.10.01 [25] including number of polymorphic sites, synonymous and non-synonymous substitutions, nucleotide diversity, number of haplotypes and haplotype diversity. The hypothesis of neutral polymorphisms was also tested using Tajima's D test [26]. Haplotypes inferred from DnaSP were imported into Network version 5.0.0.0 (www.fluxus-engineering.com/network_terms.htm) and median-joining network for the haplotypes was constructed.
A phylogenetic analysis was carried out using the Maximum Likelihood method based on the General Time Reversible model [27] through MEGA software v 6.1 using 1000 bootstrap value [28]. Molecular diversity indices, haplotype frequency, average numbers of pairwise differences and population pairwise FST values were computed using ARLEQUIN version 3.001 [29]. FST values were calculated using 1000 bootstrap. Values were imported into R program and plots were generated using the plot function in the R program [30]. Analysis of molecular variance (AMOVA) was computed to test significant differences in DBR3 locus diversity between cattle breeds. AMOVA statistics were used to show the hierarchical proportions of variance. For median network, sequences were first transformed into binary data, whereas constant sites were excluded from the analysis. Each split is encoded as a binary character taking values of 0 and 1. This method represents haplotypes as binary vector. Consensus or median vectors are estimated for each triplet of vectors until the median network is derived [31].
Results
The genomic sequences from the cattle breeds have been deposited in GenBank with accession numbers MG878460 - MG878627. Sequence analysis of the 243 bp region of the second exon of the third DRB bovine gene (BoLA-DRB3.2) which constitutes part of the peptide binding region of the DR molecule [32] was carried out to ascertain the level of diversity. A total of 100 variable sites were observed in the sequences considering all the breeds. Analysis of the BoLA-DRB3.2 sequences revealed that the Holstein breed had the highest number of polymorphisms (65) giving a frequency of one variant per 3.8 bps and Nari Master and Muturu having the least number of polymorphisms (32 a and 33, respectively), with one variant every 7.7 and 7.5 bp, respectively, if we do not consider Hereford, which we studied only 2 individuals.
A total of 15 haplotypes were identified (Table 1), by the phylogenetic analysis of all the sequences (Fig. 1). Since we found many new haplotypes not reported in the IPD-MHC Database [3], we defined a haplotype as a group of sequences not differing more than 0.02 substitutions per site and/or showing a monophyletic pattern. The breeds with the highest number of haplotypes were Brangus (10), Sokoto Gudali (10) and Dajal (9), while the lowest number was found in Holstein and Sahiwal with 4 haplotyes each. Two haplotypes were found in Hereford cattle (Table 1). When calculating the average haplotype count per individual (AHC), by dividing the number of haplotypes found in a breed by the number of animals studied, we found that the breeds with the highest AHC were N'Dama (1.00), Tharparker (0.78), Sokoto Gudali (0.77), Dajal (0.75), Brangus (071) and Red Sindhi (0.70). Sahiwal (0.31) and Achai (0.45) had the lowest AHC. Holstein and N'Dama breeds had the highest nucleotide diversity values (0.1093 and 0.1005, respectively), while Nari Master had the lowest value (0.0497), if we do not consider Hereford (Table 2). The numbers of nonsynonymous substitutions (NSS) for all the breeds were higher than synonymous substitutions. Haplotypes 3, 10, 11 and 15 were found in the largest number of individuals (Table 1), but of those, haplotypes 11 and 15 were present in the highest number of breeds, 12 and 13 breeds, respectively. Only the haplotype 9 was found exclusively in Pakistani breeds, while haplotype 6 was not found in Nigerian breeds, and haplotypes 2, 4 and 5 were not found in USA breeds (Table 1).
Molecular Phylogenetic analysis of the different sequences for all the breeds analyzed. Shaded areas represent each of the haplotypes defined as described in the text. The evolutionary history was inferred using the Maximum Likelihood method based on the General Time Reversible model [27]. The tree with the highest log likelihood (-3858.8785) is shown. A discrete Gamma distribution was used to model evolutionary rate differences among sites (5 categories (+G, parameter = 0.2303)). The tree is drawn to scale, with branch lengths measured in the number of substitutions per site. The analysis involved 174 nucleotide sequences.
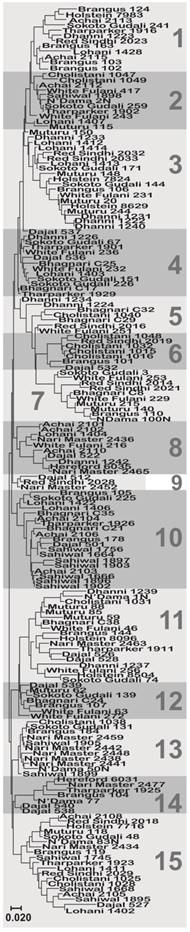
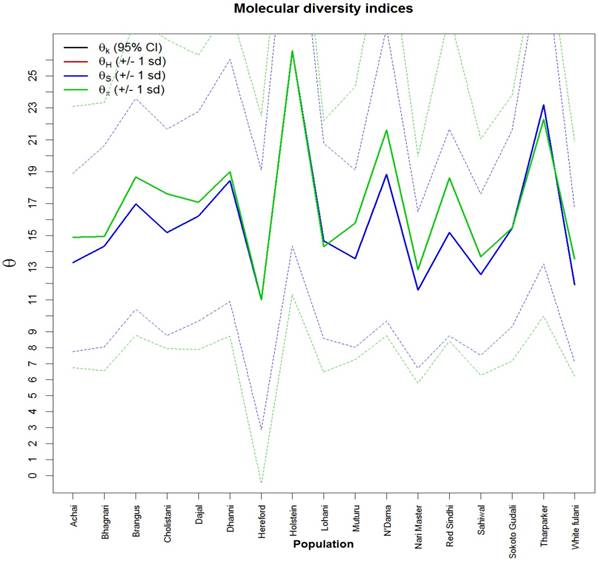
Fig. 2 showed values and the standard deviation of two different diversity indices in different cattle populations. The solid lines of different colors show the different values of the diversity indices and the dashed lines in the same color show the corresponding standard deviations. Theta S (Ɵs) ranged from 11.0 ± 2.0 in Hereford to 26.0 ± 14.0 in Holstein cattle. Also, Theta  (Ɵ
(Ɵ ) ranged from 11.0 ± 0.0 in Hereford to 26 ± 0.0 in Holstein cattle in American cattle breeds. In Asian cattle breeds, Tharparker had the highest values (23.1 ± 13.0 and 22.1 ± 9.8) of Ɵs and Ɵ
 respectively, while Sahiwal had the lowest values (12.5 ± 7.5 and 14.0 ± 6.5) of Ɵs and Ɵ
 respectively. Among African cattle breeds, highest values (19.1 ± 9.1 and 21.8 ± 8.4) of Ɵs and Ɵ
 respectively was observed in N'Dama cattle, while lowest values (12.0 ± 6.8 and 13.5 ± 6.2) of Ɵs and Ɵ
 respectively was observed in White Fulani cattle.
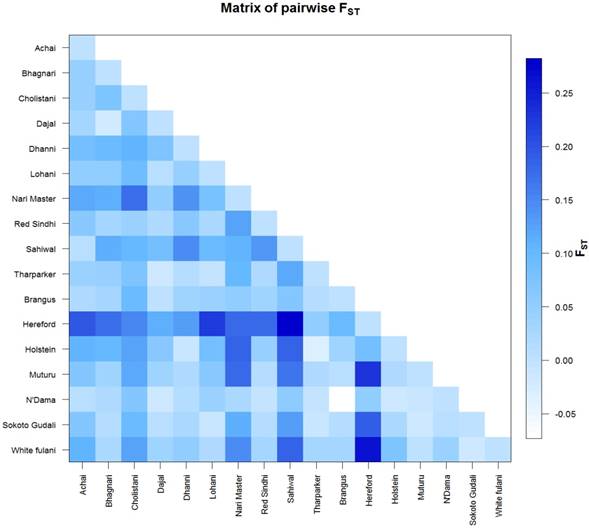
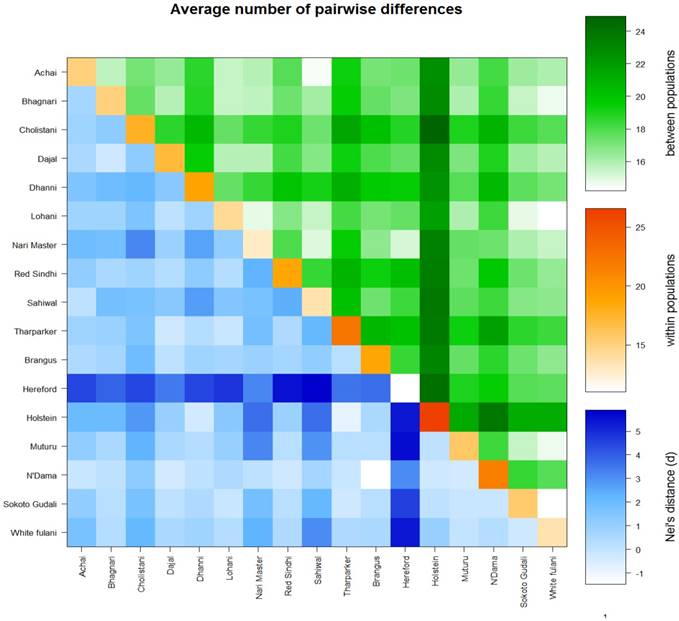
The AMOVA analysis revealed that 5.99 percent of the variation was found among populations compared with 94.01 percent variation found within populations (Table 3). Pairwise FST in American breeds was very low ranging from 0.0355 (between Brangus and Holstein) to 0.0967 (between Brangus and Hereford) as shown in Fig. 3. Pairwise FST in Asian breeds ranged from 0.0043 (between Lohani and Tharparker) to 0.1745 (between Cholistani and Nari Master). In African cattle breeds, Pairwise FST ranged from 0.0012 (between Muturu and White Fulani) to 0.0409 (between N'Dama and White Fulani). Across the continental breeds, Pairwise FST ranged from 0.0043 (between Lohani and Tharparker) to 0.2821 (between Sahiwal and Hereford). The fixation index FST was 0.0599. The Average number of pairwise differences (K) between each cattle population is presented in the upper half of the matrix (Fig. 4). The K within each breed is shown in the diagonal (orange). The lower half of the matrix (blue) showed the corrected K between the breeds (Nei distance). The K within breeds varied from 11.00 in Hereford breed to 26.57 in Holstein breed. In American breeds, K between breeds ranged from 18.53 (between Brangus and Hereford) to 24.14 (between Holstein and Hereford). K of Asian cattle breeds ranged from 14.42 (between Achai and Sahiwal) to 21.52 (between Cholistani and Tharparker). In African breeds, highest value (18.40) of K was estimated between N'Dama and Sokoto Gudali while lowest value (14.30) of K was estimated between Sokoto Gudali and White Fulani.
Haplotypes distribution among the different breeds studied, as defined in the text.
| Breed | Origen | N | Haplotypes | AHC | ||||||||||||||
|---|---|---|---|---|---|---|---|---|---|---|---|---|---|---|---|---|---|---|
| 1 | 2 | 3 | 4 | 5 | 6 | 7 | 8 | 9 | 10 | 11 | 12 | 13 | 14 | 15 | ||||
| Achai | Pakistan | 11 | 2 | 1 | 0 | 0 | 0 | 0 | 0 | 3 | 0 | 3 | 0 | 0 | 0 | 0 | 2 | 0.45 |
| Bhagnari | Pakistan | 9 | 0 | 0 | 0 | 2 | 2 | 0 | 1 | 0 | 0 | 2 | 1 | 1 | 0 | 0 | 0 | 0.67 |
| Brangus | USA | 14 | 5 | 0 | 1 | 0 | 0 | 1 | 1 | 0 | 0 | 2 | 1 | 1 | 1 | 1 | 1 | 0.71 |
| Cholistani | Pakistan | 10 | 0 | 2 | 0 | 0 | 1 | 4 | 0 | 0 | 0 | 0 | 1 | 0 | 1 | 0 | 2 | 0.60 |
| Dajal | Pakistan | 12 | 0 | 0 | 0 | 2 | 0 | 1 | 0 | 1 | 1 | 1 | 2 | 1 | 0 | 2 | 1 | 0.75 |
| Dhanni | Pakistan | 11 | 1 | 0 | 4 | 1 | 2 | 0 | 0 | 1 | 0 | 0 | 2 | 0 | 0 | 0 | 0 | 0.55 |
| Hereford | USA | 2 | 0 | 0 | 0 | 0 | 0 | 0 | 0 | 1 | 0 | 0 | 0 | 0 | 0 | 1 | 0 | 1.00 |
| Holstein | USA | 7 | 1 | 0 | 2 | 0 | 0 | 0 | 0 | 0 | 0 | 0 | 2 | 0 | 0 | 0 | 1 | 0.57 |
| Lohani | Pakistan | 11 | 1 | 1 | 3 | 1 | 0 | 0 | 0 | 1 | 0 | 2 | 0 | 0 | 0 | 0 | 2 | 0.64 |
| Muturu | Nigeria | 12 | 0 | 1 | 4 | 0 | 0 | 0 | 2 | 0 | 0 | 0 | 3 | 1 | 0 | 0 | 1 | 0.50 |
| Nari Master | Pakistan | 11 | 0 | 0 | 0 | 0 | 0 | 0 | 0 | 2 | 1 | 0 | 1 | 0 | 5 | 1 | 1 | 0.55 |
| N'Dama | Nigeria | 6 | 0 | 1 | 0 | 0 | 0 | 0 | 1 | 0 | 0 | 0 | 1 | 0 | 1 | 1 | 1 | 1.00 |
| Red Sindhi | Pakistan | 10 | 1 | 0 | 2 | 0 | 1 | 1 | 2 | 0 | 1 | 0 | 0 | 0 | 0 | 0 | 2 | 0.70 |
| Sahiwal | Pakistan | 13 | 0 | 1 | 0 | 0 | 0 | 0 | 0 | 0 | 0 | 7 | 0 | 0 | 2 | 0 | 3 | 0.31 |
| Sokoto Gudali | Nigeria | 13 | 1 | 1 | 2 | 3 | 0 | 0 | 1 | 0 | 0 | 1 | 1 | 1 | 1 | 0 | 1 | 0.77 |
| Tharparker | Pakistan | 9 | 1 | 1 | 0 | 2 | 0 | 0 | 0 | 0 | 0 | 1 | 1 | 0 | 0 | 1 | 1 | 0.78 |
| White Fulani | Nigeria | 13 | 0 | 2 | 1 | 2 | 1 | 0 | 2 | 1 | 0 | 0 | 2 | 2 | 0 | 0 | 0 | 0.62 |
| Number of Haplotypes | 174 | 13 | 11 | 19 | 13 | 7 | 7 | 10 | 10 | 3 | 19 | 18 | 7 | 11 | 7 | 19 | ||
| Number of Breeds | 8 | 9 | 8 | 7 | 5 | 4 | 7 | 7 | 3 | 8 | 12 | 6 | 6 | 6 | 13 | |||
N: Number of sequences, AHC: average haplotype count per individual, Eta: Total number of mutations, h: Number of
Molecular diversity indices of African, Asian and American cattle. The values and standard deviations of two different diversity indices in different cattle breeds. The solid lines of different colors show the different values of the diversity indices and the dashed lines in the same color the corresponding standard deviations. Theta is a population parameter of genetic differentiation. Plot was generated in R.
DNA polymorphisms and diversity in the DRB3 gene in African, Asian and American cattle.
| Breed | N | S | Eta | Hap | ASD | Pi | k | SS | NSS | Tajima D |
|---|---|---|---|---|---|---|---|---|---|---|
| Aicha | 11 | 37 | 44 | 5 | 0.057 | 0.0630 | 14.18 | 43.67 | 109.33 | -0.2632 |
| Bhagnari | 9 | 39 | 46 | 6 | 0.058 | 0.0615 | 14.94 | 45.17 | 107.17 | -0.5953 |
| Brangus | 14 | 54 | 67 | 10 | 0.069 | 0.0768 | 18.67 | 46.17 | 106.83 | -0.5035 |
| Cholistani | 10 | 42 | 49 | 6 | 0.066 | 0.0697 | 16.87 | 43.33 | 109.67 | -0.1281 |
| Dajal | 12 | 47 | 56 | 9 | 0.066 | 0.0703 | 16.88 | 43.00 | 110.00 | -0.4134 |
| Dhanni | 11 | 51 | 60 | 6 | 0.070 | 0.0736 | 17.51 | 46.33 | 106.67 | -0.6894 |
| Hereford | 2 | 11 | 11 | 2 | 0.043 | 0.0458 | 11.00 | 46.83 | 106.17 | NA |
| Holstein | 7 | 65 | 77 | 4 | 0.075 | 0.1093 | 26.57 | 47.67 | 105.33 | -0.8999 |
| Lohani | 11 | 43 | 50 | 7 | 0.056 | 0.0589 | 14.31 | 44.67 | 108.33 | -0.764 |
| Muturu | 12 | 33 | 36 | 6 | 0.059 | 0.0765 | 12.62 | 45.17 | 107.33 | 0.2664 |
| Nari Master | 11 | 32 | 42 | 6 | 0.047 | 0.0497 | 11.93 | 42.50 | 110.50 | -0.7901 |
| N'Dama | 6 | 39 | 48 | 6 | 0.082 | 0.1005 | 19.60 | 44.00 | 109.00 | -0.4331 |
| Red Sindhi | 10 | 43 | 54 | 7 | 0.072 | 0.0766 | 18.62 | 43.83 | 109.17 | -0.1196 |
| Sahiwal | 13 | 39 | 48 | 4 | 0.051 | 0.0562 | 13.67 | 47.17 | 105.83 | -0.5209 |
| Sokoto Gudali | 13 | 43 | 52 | 10 | 0.055 | 0.0608 | 14.77 | 44.83 | 108.17 | -0.5319 |
| Tharparker | 9 | 63 | 75 | 7 | 0.067 | 0.0917 | 22.28 | 42.83 | 110.17 | -0.9907 |
| White Fulani | 13 | 30 | 35 | 8 | 0.051 | 0.0657 | 10.83 | 46.50 | 106.50 | -0.1745 |
| Overall | 174 | 105 | 150 | 15 | 0.065 | 0.0774 | 17.41 | 44.67 | 103.33 | -1.0706 |
N: Number of sequences, S: Number of polymorphic sites, Eta: Total number of mutations, Hap: Number of Haplotypes, ASD: estimates of average sequence divergence within breeds, Pi: Nucleotide diversity, k: Average number of nucleotide differences, SS: synonymous substitutions, NSS: non-synonymous substitutions NA: not available.
Haplotypes shared among cattle breeds across African, American and Asian cattle
| Source of variation | Degree of freedom | Variance components | Percent of variation |
|---|---|---|---|
| Among population | 16 | 0.5336 | 5.99 |
| Within population | 157 | 8.3757 | 94.01 |
Genetic differentiation between cattle breeds. The FST values are coded with a color code with the legend on the right side. The colors ranged from skye blue to deep blue and correspond to the FST values
Genetic differentiation within and between cattle breeds. Average number of pairwise differences between cattle breeds. The average number of pairwise differences between each cattle breed in the upper half of the matrix (green). The average number of pairwise differences within each cattle breed is shown in the diagonal (orange). The lower half of the matrix (blue) showed the corrected average number of pairwise differences between cattle breeds
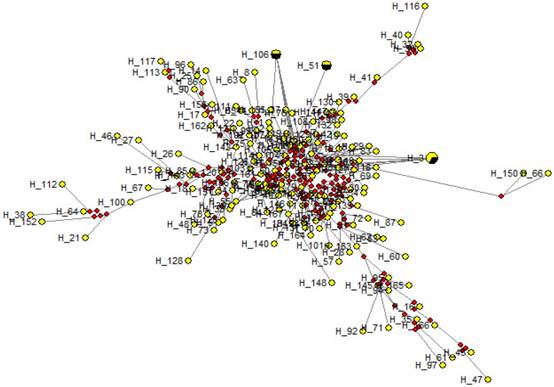
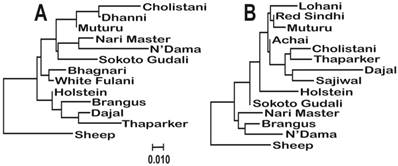
Medium Joining network obtained from sequence data showed that all sequences were condensed around a centric area and each sequence (except in H-3, H-51 and H-106) were present in a single individual (Fig. 5) Each circle represents a unique sequence in which the diameter is proportional to the number of sequence represented. The evolutionary relationships among the cattle breeds from three continents at the BoLA-DRB3.2 locus are presented in Figure 6. It is evident that there are big differences between the two trees constructed using different haplotypes, which is an indication of different evolutionary history for each allele.
Discussion
DRB3 is the only functional gene of the three BoLA DRB genes and is the most polymorphic class II gene in cattle and closely linked with DQ, hence DRB3 diversity is considered the diversity of entire class IIa [33]. Here we found a high level of polymorphisms in the second exon of the third DRB bovine gene (BoLA-DRB3.2) across the African, American and Asian cattle breeds. Likewise, high variation for standard diversity indices were observed among the cattle breeds studied. These results corroborated the findings of Takeshima et al. [34] who observed a total of 46 alleles of BoLA-DRB3.2 in the cattle breed used in their study. Wang et al. [35] reported that DRB3 gene is the most widely studied class II gene as it is extremely polymorphic. Wu et al. [36] reported 284 bp of PCR product of the entire exon 2 in Chinese Holstein cattle.
Nucleotide and haplotype diversities are two most often used indices in assessing the level of genetic diversity of populations or of a gene in a population [37; 38, 39]. The ability of a population to respond effectively to pathogenic and parasitic infestation is highly dependent on the level of genetic diversity at the MHC loci [7, 8, 40, 41]. High level of haplotype and nucleotide diversities observed in a BoLA-DRB3.2 region across the cattle breeds studied in this research would result in increased population fitness which has a positive impact in livestock breeding. Generally, in American cattle breeds, the estimated diversity indices suggest that Holstein cattle exhibit the highest diversity in terms of DRB3.2. The high nucleotide diversity estimated in Holstein might be due to wide distribution of the breed, since is the leading breed in terms of milk yield and are raised in diverse environments all over the world. Hereford breed on the other hand, showed low variability, and may be due to that it can be found in Europe and mostly in North America and are therefore not widely dispersed like Holstein cattle, which make them less exposed to pathogenic insults. Also, small sample size of Hereford breed might contribute to its lower variation.
A median joining network for the sequences obtained among temperate and tropical cattle. Circles represent individual sequences and have a size proportional to frequency. The red squares represent the median vector; Branch length is proportional to the number of mutations. The numbers on each edge denote the position of nucleotides within the sequence that differ between the sequences.
Molecular phylogenetic analysis of the cattle breeds with Sheep (Ovis aries) as outgroup. The evolutionary history was inferred using the Maximum Likelihood method based on the General Time Reversible model [27]. The trees were build using the sequences of haplotypes 11 (A) and 15 (B), which were the most common among the breeds. The trees with the highest log likelihoods (-765.5423 and -759.5334, respectively) are shown. A discrete Gamma distribution was used to model evolutionary rate differences among sites (5 categories (+G, parameter = 0.1329 and 0.1014, respectively)). The trees are drawn to scale, with branch lengths measured in the number of substitutions per site. The analysis involved 13 and 14 nucleotide sequences, respectively.
In African cattle breeds, the estimated diversity indices suggested that N'Dama cattle exhibited relatively highest diversity at the DRB3.2 locus. In terms of haplotype diversity, number of polymorphic site, mutations and haplotypes, African cattle breeds had higher values as compared with Asian cattle breeds. The high haplotype frequency observed in African cattle may have a selective advantage as the haplotype may offer resistance toward a specific disease or pathogen [42] in the short term. It is important to note that, African cattle breeds are raised mostly by Nomadic farmers who move across forest area in search of feed for cattle where pathogens and parasites are more predominant. Hence, in the long term, it may lower the breeds' ability to respond quickly to emerging diseases or pathogens [43].
The higher nonsynonymous substitutions in this study compared to synonymous substitutions is noteworthy. Some studies have shown that nonsynonymous variants have been associated with susceptibility to ovarian cancer [44] and H1N1 influenza [45]. In cattle, a nonsynonymous variant has been associated with resistance to mastitis and lower risk of Behcet's disease [46, 47]. Furthermore, Gillett et al. [43] found that DRB sequences of the major histocompatibility complex of North Atlantic right whales (Eubalaena glacialis) showed significantly different from neutrality at peptide binding sites suggesting loci may be under the influence of balancing selection.
Gowane et al. [48] found that some alleles of the DRB3 gene were associated with reproductive performance in crossbred cows of the Indian Hariana breed (Bos indicus) and Holstein Friesian (Bos taurus). Ober et al. [49] and Hvid [50] reported that offspring of parents with similar genotypes in the HLA genes negatively affect reproduction, increasing the chance of fetal loss. The negative Tajima's D values recorded for all cattle breeds except the Hereford showed excess of rare alleles [26]. The negative estimates of Tajima's D further indicated that there was more variation than would be expected from normal population and we could infer that selection is maintaining variation in BoLA-DRB3 locus in the populations studied.
BoLA-DRB3.2 sequences analyses revealed a non-significant higher rate of non-synonymous (dN) compared to synonymous substitutions (dS). A ratio of (dN/dS) greater than one suggests that variation at the antigen-binding sites is under positive selection; probably for the recognition of a wide range of infectious agents [51]. MacEachern et al. [52] suggested that the domestication process in the lineages leading to the Domestic cow has contributed to higher dN/dS ratios in cattle, however, this high rate of dN/dS polymorphism within B. Taurus, when compared to species divergence in Bovini tribe, suggest that positive selection has not elevated evolutionary rates in these genes. It could therefore be inferred that the BoLA-DRB3.2 of cattle breeds studied are under positive selection thus, making them to be highly responsive to pathogenic offenses.
The value of pairwise FST of all breeds studied indicated a relatively low genetic differentiation between breeds within each continent. These results are in consonance with early study of Hussain et al. [53] who reported 0.1456 for FST in Asian cattle breeds using microsatellite. The beef breeds such as Angus and Hereford are genetically closer than the distance between beef and dairy breeds. This result suggests that selection for specific type of use have shaped the genome of the cattle breeds used in this investigation. Also, there is a mild genetic differentiation across continental cattle breeds. The results of pairwise FST can be used as short-time genetic distance between populations with a slight transformation to linearize the distance with population divergence time (28). The partitioning of genetic variation from AMOVA also showed that the foremost amount of genetic variation was always found among individuals within breeds, revealed that 5.99 percent of genetic variation was accounted for by differences among populations and 94.01 percent was within populations. The network revealed considerable diversity among the different cattle breeds.
Conclusion
In this study, we have for the first time, compared diversity and polymorphism at the BoLA DRB3.2 locus between African, American and Asian cattle breeds. We established that these cattle breeds are divergent at this locus and that this diversity and polymorphisms may be crucial for population-level disease resistance in the cattle breeds studied. We have found many new haplotypes, not previously reported. This study also further confirms the importance of the MHC region in livestock and greatly expands our knowledge of the diversity and polymorphisms at this locus by looking at breeds from Africa and Asia that are usually less studied because they do not belong to the widely used breeds in Europe and America. Results from this study suggests that association of this locus with traits in the cattle breeds will further improve our understanding of the genetic architecture of this region in cattle and population genetics of these breeds across three continents as distinctive genetic resources which have to be conserved for sustainable native cattle genetic diversity.
Acknowledgements
We are grateful for the financial support from the College of Agriculture and Life Sciences, Cornell University, Ithaca, NY and Zoetis, Inc. Additional support by National Research Initiative Competitive Grant Program (Grant No. 2006-35205-16864) from the USDA National Institute of Food and Agriculture, USDA-NIFA Research Agreements (Nos. 2009-65205-05635, 2010-34444-20729) and USDA Federal formular Hatch funds appropriated to the Cornell University Agricultural Experiment Station are gratefully acknowledged. SOP was supported by Berry College Faculty Start-up Funds. TH was supported by Higher Education Commission of Pakistan.
Authors' contributions
SOP, TH and IGI conceived the project, SOP, TH, MDD and IGI designed and performed the experiments, SOP, AA, MAA, JH and TH analyzed the data; SOP, AA, MAA, MDD and IGI wrote the manuscript; TH, JH and MEB contributed to the scientific content. All authors read and approved the final manuscript.
Competing Interests
The authors have declared that no competing interest exists.
References
1. Alvarez-Busto J, García-Etxebarria K, Herrero J, Garin I, Jugo BM. Diversity and evolution of the Mhc-DRB1 gene in the two endemic Iberian subspecies of Pyrenean chamois, Rupicapra pyrenaica. Heredity. 2007Oct;99(4):406
2. Amills M, Jiménez N, Jordana J, Riccardi A, Fernandez-Arias A, Guiral J, Bouzat JL, Folch J, Sanchez A. Low diversity in the major histocompatibility complex class II DRB1 gene of the Spanish ibex, Capra pyrenaica. Heredity. 2004;93(3):266
3. Behl JD, Verma NK, Tyagi N, Mishra P, Behl R, Joshi BK. The major histocompatibility complex in bovines: a review. ISRN Vet Sci. 2012;2012:872710
4. Miyasaka T, Takeshima SN, Matsumoto Y, Kobayashi N, Matsuhashi T, Miyazaki Y, Tanabe Y, Ishibashi K, Sentsui H, Aida Y. The diversity of bovine MHC class II DRB3 and DQA1 alleles in different herds of Japanese Black and Holstein cattle in Japan. Gene. 2011;472(1):42-9
5. Takeshima SN, Aida Y. Structure, function and disease susceptibility of the bovine major histocompatibility complex. Anim Sci J. 2006;77(2):138-50
6. Behl JD, Verma NK, Behl R, Mukesh M, Ahlawat SP. Characterization of genetic polymorphism of the bovine lymphocyte antigen DRB3. 2 locus in Kankrej cattle (Bos indicus). Journal of dairy science. 2007;90(6):2997-3001
7. Sun L, Song Y, Riaz H Yang L. Effect of BoLA-DRB3 exon2 polymorphisms on lameness of Chinese Holstein cows. Mol Biol Rep. 2013;40(2):1081-1086
8. Carignano HA, Beribe MJ, Caffaro ME, Amadio A, Nani JP, Gutierrez G, Alvarez I, Trono K, Miretti MM, Poli MA. BOLA-DRB3 gene polymorphisms influence bovine leukaemia virus infection levels in Holstein and Holstein× Jersey crossbreed dairy cattle. Anim Genet. 2017;48:420-430
9. Takeshima SN, Miyasaka T, Polat M, Kikuya M, Matsumoto Y, Mingala CN, Villanueva MA, Salces AJ, Onuma M, Aida Y. The great diversity of major histocompatibility complex class II genes in Philippine native cattle. Meta gene. 2014;2:176-90
10. Miyasaka T, Takeshima SN, Jimba M, Matsumoto Y, Kobayashi N, Matsuhashi T, Sentsui H, Aida Y. Identification of bovine leukocyte antigen class II haplotypes associated with variations in bovine leukemia virus proviral load in Japanese Black cattle. HLA. 2013;81(2):72-82
11. Bai L, Otsuki H, Sato H, Kohara J, Isogai E, Takeshima SN, Aida Y. Identification and characterization of common B cell epitope in bovine leukemia virus via high-throughput peptide screening system in infected cattle. Retrovirology. 2015;12(1):106
12. Juliarena MA, Lendez PA, Gutierrez SE, Forletti A, Rensetti DE, Ceriani MC. Partial molecular characterization of different proviral strains of bovine leukemia virus. Archives of virology. 2013;158(1):63-70
13. Lützelschwab CM, Forletti A, Cepeda R, Esteban EN, Confalonieri O, Gutiérrez SE. Co-infection with Mycobacterium bovis does not alter the response to bovine leukemia virus in BoLA DRB3* 0902, genetically resistant cattle. Research in veterinary science. 2016;109:10-6
14. Das DN, Sri Hari VG, Hatkar DN, Rengarajan K, Saravanan R, Suryanarayana VV, Murthy LK. Genetic diversity and population genetic analysis of bovine MHC class II DRB3. 2 locus in three Bos indicus cattle breeds of Southern India. International journal of immunogenetics. 2012;39(6):508-19
15. Giovambattista G, Golijow CD, Dulout FN, Lojo MM. Gene frequencies of DRB3. 2 locus of Argentine Creole cattle. Anim Genet. 1996;27(1):55-6
16. Takeshima SN, Giovambattista G, Okimoto N, Matsumoto Y, Rogberg-Muñoz A, Acosta TJ, Onuma M, Aida Y. Characterization of bovine MHC class II DRB3 diversity in South American Holstein cattle populations. HLA. 2015;86(6):419-30
17. Oprzadek J, Sender G, Pawlik A, Lukaszewicz M. Locus BoLA-DRB3 is just an ordinary site of the polygene when explaining genetic variance of somatic cell count and milk yield. Journal of Dairy Research. 2015;82(4):449-52
18. Dietz AB, Detilleux JC, Freeman AE, Kelley DH, Stabel JR, Kehrli ME. Genetic Association of Bovine Lymphocyte Antigen DRB3 Alleles with Immunological Traits of Holstein Cattle1. Journal of Dairy Science. 1997;80(2):400-5
19. Gilliespie BE1, Jayarao BM, Dowlen HH, Oliver SP. Analysis and frequency of bovine lymphocyte antigen DRB3.2 alleles in Jersey cows. J Dairy Sci. 1999;82(9):2049-53
20. Takeshima S, Saitou N, Morita M, Inoko H, Aida Y. The diversity of bovine MHC class II DRB3 genes in Japanese Black, Japanese Shorthorn, Jersey and Holstein cattle in Japan. Gene. 2003;316:111-8
21. Takeshima S, Chen S, Miki M, Kado M, Aida Y. Distribution and origin of bovine major histocompatibility complex class II DQA1 genes in Japan. HLA. 2008;72(3):195-205
22. Babar ME, Hussain T, Nadeem A, Jabeen R, Javed M. Genetic characterization of Azakheli buffalo breed of Pakistan using microsatellite DNA markers. Pak J Zool. 2009;9:361-6
23. Untergasser A, Cutcutache I, Koressaar T, Ye J, Faircloth BC, Remm M Rozen SG. Primer3-new capabilities and interfaces. Nucleic Acids Res. 2012;40(15):e115-e115
24. Thompson JD, Higgins DG Gibson TJ. CLUSTAL W: improving the sensitivity of progressive multiple sequence alignment through sequence weighting, position-specific gap penalties and weight matrix choice. Nucleic Acids Res. 1994;22:4673-4680
25. Rozas J, Sánchez-DelBarrio JC, Messeguer X, Rozas R. DnaSP, DNA polymorphism analyses by the coalescent and other methods. Bioinformatics. 2003;19(18):2496-7
26. Tajima F. Statistical method for testing the neutral mutation hypothesis by DNA polymorphism. Genetics. 1989;123:585-595
27. Tamura K, Stecher G, Peterson D, Filipski A, Kumar S. MEGA6: Molecular Evolutionary Genetics Analysis version 6.0. Mol Biol Evol. 2013;30:2725-2729
28. Nei M, Kumar S. Molecular Evolution and Phylogenetics. Oxford University Press, New York. 2000
29. Excoffier L. and H.E. L. Lischer. Arlequin suite ver 3.5: A new series of programs to perform population genetics analyses under Linux and Windows. Mol Ecol Resour. 2010;10:564-567
30. R Core Team. R: A language and environment for statistical computing. R Foundation for Statistical Computing, Vienna, Austria. 2013
31. Bandelt HJ, Forster P, Röhl A. Median-joining networks for inferring intraspecific phylogenies. Molecular biology and evolution. 1999;16(1):37-48
32. Dukkipati VS, Blair HT, Garrick DJ, Murray A. Ovar-Mhc'-ovine major histocompatibility complex: structure and gene polymorphisms. Genet Mol Res. 2006;5(4):581-608
33. Paracha H, Hussain T, Tahir MZ, Yasmeen A, Pervez MT, Sheikh AA, Haider A, Ali R, Khan WA. Multifunctional DRB3, a MHC class II gene, as a useful biomarker in small ruminants: a review. J Inf Mol Biol. 2015;3(1):19-23
34. Takeshima SN, Miyasaka T, Matsumoto Y, Xue G, de la Barra Diaz V, Rogberg-Muñoz A, Giovambattista G, Ortiz M, Oltra J, Kanemaki M, Onuma M. Assessment of biodiversity in Chilean cattle using the distribution of major histocompatibility complex class II BoLA-DRB3 allele. HLA. 2015;85(1):35-44
35. Wang K, Sun DX, Li KY, Wang XQ Zhang F. Identification of four novel alleles of the BoLA-DRB3 upstream regulatory region in Chinese yellow cattle. Tissue Antigens. 2012;80(1):58-60
36. Wu XX, Yang ZP, Wang XL, Mao YJ, Li SC, Shi XK, Chen Y. Restriction fragment length polymorphism in the exon 2 of the BoLA-DRB3 gene in Chinese Holstein of the south China. J Biomed Sci Eng. 2010;3(2):221
37. Kul BC, Ertuğrul O. mtDNA diversity and phylogeography of some Turkish native goat breeds. Vet Fak Derg. 2011;58(2):129-34
38. Agaviezor BO, Peters SO, Adefenwa MA, Yakubu A, Adebambo OA, Ozoje MO, Ikeobi CO, Wheto M, Ajayi OO, Amusan SA, Ekundayo OJ. Morphological and microsatellite DNA diversity of Nigerian indigenous sheep. J Anim Sci Biotechnol. 2012;3(1):38
39. Adefenwa MA, Peters SO, Agaviezor BO, Wheto M, Adekoya KO, Okpeku M, Oboh B, Williams GO, Adebambo OA, Singh M, Thomas B. Identification of single nucleotide polymorphisms in the agouti signaling protein (ASIP) gene in some goat breeds in tropical and temperate climates. Mol Biol Rep. 2013;40(7):4447-57
40. Hedrick PW Kim TJ. Genetics of complex polymorphisms: parasites and the maintenance of the major histocompatibility complex variation. Singh RS, Krinbas CB Evolutionary Genetics: From molecules to morphology. Cambridge University Press: Cambridge, UK. 2000:204-234
41. Ojong BW, Saccà E, Bessong P Piasentier E. Prevalence of bovine dermatophilosis and disease-associated alleles in zebu Goudali cattle and their Italian Simmental crosses ranching in the western highland plateau savannah of Cameroon. Trop Anim Health Prod. 2016;48(7):1329-1335
42. Milinski M. The major histocompatibility complex, sexual selection, and mate choice. Annu Rev Ecol Syst. 2006;37:156-186
43. Gillett RM, MuRRay BW, White BN. Characterization of Class I and Class II-Like Major Histocompatibility Complex Loci in Pedigrees of North Atlantic Right Whales. Heredity. 2014;105(2):188-202
44. Charbonneau B, Block MS, Bamlet WR. et al. Risk of ovarian cancer and the NF-Kb pathway: genetic association with IL1A and TNFSF10. Cancer Res. 2014;74:852-861
45. Liu Y, Li S, Zhang G. et al. Genetic variants in IL1A and IL1B contribute to the susceptibility to 2009 pandemic H1N1 influenza A virus. BMC Imunology. 2013;14:37
46. Chen R, Wang Z, Yang Z, Zhu X, Ji D, Mao Y. Association of IL8-105G/A with mastitis somatic cell score in Chinese Holstein dairy cows. Anim Biotechnol. 2015;26(2):143-7
47. Koca SS, Kara M, Deniz F, Ozgen M, Demir CF, Ilhan N, Isik A. Serum IL-33 level and IL-33 gene polymorphisms in Behçet's disease. Rheumatol Int. 2015;35(3):471-7
48. Gowane GR, Sharma AK, Vandre RK, Sankar M. Association of DRB 3 EXON 2 Alleles with Productive and Reproductive Performance of Crossbred Cattle. J Adv Vet Res. 2013;3(1):31-5
49. Ober C, Hyslop T, Elias S, Weitkamp LR, Hauck WW. Human leukocyte antigen matching and fetal loss: results of a 10 year prospective study. Hum Reprod. 1998;13(1):33-8
50. Hviid TV. HLA-G in human reproduction: aspects of genetics, function and pregnancy complications. Hum Reprod Update. 2006;12(3):209-32
51. Hughes AL, Yeager M. Natural selection at major histocompatibility complex loci of vertebrates. Annu Rev Genet. 1998;32(1):415-35
52. MacEachern S, McEwan J, McCulloch A, Mather A, Savin K, Goddard M. Molecular evolution of the Bovini tribe (Bovidae, Bovinae): Is there evidence of rapid evolution or reduced selective constraint in Domestic cattle? BMC genomics. 2009;10(1):179
53. Hussain T, Babar ME, Peters SO, Wajid A, Ali A, Azam A, Ahmad Z, Wasim M, Ali A, Kizilkaya K, De Donato M. Microsatellite Markers Based Genetic Evaluation of Pakistani Cattle Breeds. Pak J Zool. 2016:48 (6)
Author contact
![]() Corresponding author: Dr. Sunday O Peters, Department of Animal Science, Berry College, Mount Berry, GA 30149, USA. Tel: +1 706-368-6919, Email: spetersedu
Corresponding author: Dr. Sunday O Peters, Department of Animal Science, Berry College, Mount Berry, GA 30149, USA. Tel: +1 706-368-6919, Email: spetersedu